I really don’t know how to start explaining what is a Dragon Curve. However, I find it is interesting enough after finding out that there’s actually a fixed pattern of occurrence. Therefore I spent some time writing a series of scripts to plot the generated fractal into a graph. What I didn’t expect is, the series get really complicated after a while.
So I start by briefly explain what a Dragon Curve is. The best way to visualize it is to find a long strip of paper, and fold it in half (this is the first iteration). Then expand the paper and arrange the crease such that each of them is a 90 degree angle. Hence the first iteration is an L shape.
Then fold the paper back, and fold once again from the middle in half at the same direction (second iteration). Then expand the paper and rearrange the creases into 90 degree angles again, then a new shape is generated. Repeat this as many times as possible, assuming papers can be easily folded after 6th / 7th iteration.
The explanation is pretty bad, I know.
Anyway, I give up on trying to explain and decide to directly post the solution. I actually re-used some new strategy picked up in the previous quiz. So I first generate a sequence of turns to determine whether to turn left or right for each step.
#!/usr/bin/env php
<?php

define('LEFT', 0);
define('RIGHT', 1);
define('LEFT_OUTPUT', json_encode(array(array(0, 1), array(-1, 0), 'L')));
define('RIGHT_OUTPUT', json_encode(array(array(0, -1), array(1, 0), 'R')));

turn_print_matrix(turn_direction([constant($argv[1])], intval($argv[2])));

function turn_print_matrix($turns) {
    array_walk(
        $turns,
        function($turn) {
            if($turn == LEFT) {
                printf('%s%s', LEFT_OUTPUT, PHP_EOL);
            } else {
                printf('%s%s', RIGHT_OUTPUT, PHP_EOL);
            }
        }
    );
}

function turn_direction($result, $turns, $current = 1) {
    return $current == $turns ?
        $result
        : turn_direction(turn_iterate($result), $turns, $current + 1);
}

function turn_iterate($current) {
    return call_user_func_array(
        'array_merge',
        array_map(
            function($index) use($current) {
                $result = array();
                array_push($result, ($index + $current[0]) % 2);

                if(array_key_exists($index, $current)) {
                    array_push($result, $current[$index]);
                }

                return $result;
            },
            range(0, count($current))));
}
Then I generate the sequence by defining where the second point should go (assuming the first point is the origin in cartesian plane).
#!/usr/bin/env php
<?php

#stepper(array(0, 0), input_init($argv), reader());

$point = array(0, 0);
$vector = input_init($argv);

point_print($point);

while($next = reader()) {
    $point = route_move($point, $vector);

    point_print($point);

    $vector = vector_next($vector, $next);
}

point_print($point);

function stepper($point, $vector, $next) {
    if($point == array(0, 0)) {
        point_print($point);
    }

    point_print(route_move($point, $vector));

    return feof(STDIN) === FALSE ?
        stepper(
            route_move($point, $vector),
            vector_next($vector, $next),
            reader())
        : TRUE;
}

function reader() {
    return json_decode(trim(fgets(STDIN)));
}

function point_print($point) {
    printf('%s%s', json_encode($point), PHP_EOL);
}

function route_move($last_step, $vector) {
    return array(
        $last_step[0] + $vector[0],
        $last_step[1] + $vector[1]);
}

function vector_next($last_vector, $direction) {
    return array(
        $direction[0][0] * $last_vector[0] + $direction[0][1] * $last_vector[1],
        $direction[1][0] * $last_vector[0] + $direction[1][1] * $last_vector[1]
    );
}

function input_init($input) {
    return array(intval($input[1]), intval($input[2]));
}
Next to actually plot it
#!/usr/bin/env php
push($next[0], $next[1]);
}
echo $plot->get();
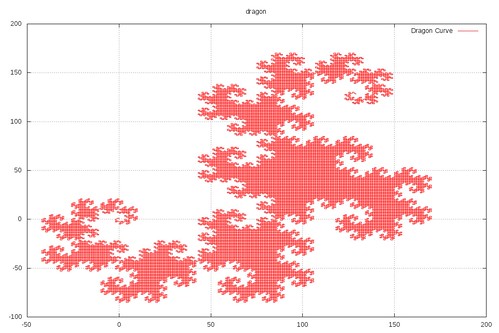
echo stepper(plot_initialize('dragon'), reader())->get();
function plot_initialize($title) {
$plot = new GnuPlot();
$plot->setGraphTitle($title);
$plot->setTitle(0, 'Dragon Curve');
return $plot;
}
function stepper(GnuPlot $plot, $next) {
if(empty($next) == FALSE) {
$plot->push($next[0], $next[1]);
}
return feof(STDIN) === FALSE ?
stepper($plot, reader())
: $plot;
}
function reader() {
return json_decode(trim(fgets(STDIN)));
}I am using composer to actually handle my dependencies, so my composer.json looks like this
{
    "require": {
        "gregwar/gnuplot": "dev-master",
        "davefx/phplot": "dev-master",
        "libchart/libchart": "dev-default"
    }
}
In order to actually generate something to see, just call the chain of scripts as follows.
./direction.php ${RIGHT|LEFT} ${fold-count} | ./route.php ${x} ${y} | ./plotter.php > ${output-png-file}
e.g.
./direction.php RIGHT 15 | ./route.php 0 1 | ./plotter.php > foo.png
yields,