This is the formal draft of my statistical analysis report for the social audit project previously mentioned here. As the project is public by nature, I am cross-posting here for own reference.
Methodology
The result of the survey which started on 10th of November 2020, and then collected on 23rd of November for analyzing. 110 responses were collected from the residents of USJ 16 Sri Tanjung Flats for this analysis. The responses first went through a series of preprocessing and visualization with the use of Jupyter notebook <https://jupyter.org/>, which is a tool to visualize and manipulate data. The collected data then gets processed by code written in Python, a programming language <https://www.python.org/>. After a round of preprocessing (spelling errors, aggregating responses with the same meaning), they are then counted and tabulated into dataframes <https://pandas.pydata.org/> for further processing.
In this study, we are interested in finding out if a person’s age, gender, employment status, household income and education level their access to the Internet. One thing to note is that the field for gender was added at a later stage of the response, hence for that factor there were 28 entries that were excluded for that study. The list of questions that were chosen for the study of internet access are as follows (in no particular order):
- How does a respondent access government service?
- What internet-enabled devices does a respondent own and use?
- Whether a respondent gets to access the internet as much as desired?
- Has a respondent used public Wi-Fi service?
- Has a respondent used public Wi-Fi service provided by the government (e.g. Wi-Fi Selangorku, Wi-Fi Smart Selangor by the Selangor state government)?
- Whether a respondent is able to and can afford to work from home?
- Whether a respondent can comfortably work from home?
- Can family members of a respondent learn online, if applicable?
- Are the family members of a respondent able to learn comfortably online (if applicable)?
- How much would a respondent pay a month for internet access service?
- How much would a respondent pay for a computer or laptop (notebook computer)?
- How much would a respondent pay for a smartphone or tablet?
Selected answers with respect to the previously mentioned factors were tested for independence via chi-square test at alpha=0.05. The null hypothesis for the test was the two variables (e.g. gender and how does a respondent access government service) are independent, and then the alternative hypothesis was the two variables are not independent, or they are associated.
If the null hypothesis is rejected for a given pair of variables, we can then proceed with another test to see how changes in one affects the outcome of another. Correlation analysis was done for pairs involving age, household income and education level, as we could rank the responses accordingly. The correlation coefficient for the pairs of variables are then calculated with Spearman’s rank correlation coefficient, as age, household income (which we aggregated the values of these two variables into bins) and education level cannot be represented in numeric form.
After obtaining the coefficient where the degree and type of correlation (e.g. weak positive correlation, very high negative correlation etc.) is determined, we proceed to perform hypothesis testing for correlation to see if the correlation is significant. Student test, or t-test at alpha = 0.05 was conducted for this test as the observed distinct pairs of both variables was fewer than 30. For the significant test for correlation, the null hypothesis was the correlation between variables are significant, and the alternative hypothesis was the correlation are insignificant.
However, for gender employment status, as we cannot rank the responses to these variables, correlation analysis therefore could not be performed. A test to find the difference in mean between groups of responses were to be performed, however possibly due to the insufficient responses or a flaw in the questionnaire we were unable to perform this test as none of the pair of variables were associated.
The analysis result that shows pairs that are associated, as well as their result for correlation, are shown in the following section.
Analysis result
Budget for internet access is binned to the following groups (in Malaysian Ringgit)
- Greater than -0.001 and less than or equal to 50.0
- Greater than 50.0 and less than or equal to 150.0
- Greater than 200.0 and less than or equal to 250.0
- Greater than 250.0 and less than or equal to 300.0
- Greater than 350.0 and less than or equal to 400.0
- Greater than 400.0 and less than or equal to 450.0
- Greater than 450.0 and less than or equal to 500.0
When we compare household income to the budget for internet access (refer to the table and graph below), we found these both variables are associated at test statistic 64.9907, which is greater than the critical region of 41.3371. As mentioned the alpha value chosen for independence study was 0.05, which means if we repeat the same survey and analysis, 95% of the time we would draw the same conclusion. The following table and graph shows the observed count for the different pairs of values for the two variables (rows and columns with only zeros are removed from the table).
| budget internet | (-0.001, 50.0] | (50.0, 100.0] | (100.0, 150.0] | (150.0, 200.0] | (450.0, 500.0] |
| Household income | |||||
| (-8.001, 1000.0] | 5 | 2 | 0 | 0 | 0 |
| (1000.0, 2000.0] | 21 | 5 | 0 | 0 | 0 |
| (2000.0, 3000.0] | 20 | 10 | 2 | 0 | 0 |
| (3000.0, 4000.0] | 13 | 10 | 0 | 1 | 1 |
| (4000.0, 5000.0] | 5 | 2 | 0 | 1 | 0 |
| (5000.0, 6000.0] | 0 | 3 | 0 | 1 | 0 |
| (6000.0, 7000.0] | 0 | 0 | 1 | 2 | 0 |
| (7000.0, 8000.0] | 0 | 2 | 0 | 0 | 0 |

For the budget in the (-0.001, 50] bin, the negative correlation between household income and itself is high at -0.7856, which means an increase in household income would yield a lower count in this bracket of budget. However, the correlation is not significant as the test statistic is at -2.1995 which is within the critical region ±3.1824. Therefore, there is no significant correlation between the household income and the monthly budget for internet access in the population (i.e. all residents of USJ 16 Sri Tanjung Flats).
There is some negative correlation at -0.4542 for budget in the (50.0, 100.0] bin. However, there’s also no significant correlation in the population, with the test statistic -0.8830 and the critical region ±3.1824,
A very low correlation is found at 0.0623 for budget in the (100.0, 150.0] bin, which means an increase in household income also decreases the number would yield higher count in this bracket of budget. However, the correlation is also insignificant at the same alpha value with the test statistics of 0.1082 which is within the critical region ±3.1824.
There is some correlation for budget in the (150.0, 200.0] bin where the correlation is 0.4956. However, the null hypothesis is failed to be rejected as well here where the test statistic is 0.9882 and it is within the critical region of ±3.1824.
Lastly there is a negative correlation which is very low at -0.0825 for budget in the (450.0, 500.0] bin. As other cases mentioned above, the correlation is not significant with the test statistic -0.1433 and critical region ±3.1824.
There were 5 different types of devices observed in the survey response, in which are owned and used by the respondents, namely:
- Desktop computer
- Laptop (notebook computer including netbooks)
- Tablet computer (e.g. Apple iPad, Samsung Galaxy Tab etc.)
- Gaming console (e.g. Sony PlayStation, Nintendo Switch, Microsoft Xbox)
- Smartphone
- Smart TV
- Android TV Box (Set-top boxes running Android as the operating system)
The null hypothesis is rejected for education level and types of devices owned and used by respondents where the test statistic is 15.7739, which exceeds the critical value 12.5915.
| Desktop computer | Laptop | Tablet computer | Gaming console | Smartphone | Smart TV | Android TV box | |
| Educationlevel | |||||||
| Secondary school | 4 | 9 | 5 | 4 | 46 | 1 | 1 |
| Highereducation | 15 | 37 | 17 | 4 | 60 | 0 | 0 |

There is a perfect correlation between the education level and ownership and use of a desktop computer at 1.0000. This means when the education level increases, the observed count of ownership and use for desktop computer is higher. The test for significance also shows the correlation is significant where the test statistic is134217728.0000, which is greater than the critical region ±2.7764.
Similarly, another perfect correlation between the education level and ownership and use of a laptop at 1.0000. The correlation is also significant where the test statistic is 134217728.0000, which is greater than the critical region ±2.7764.
The perfect correlation is also found when the device is a tablet at 1.0000. As like the previous cases, the correlation is significant where the test statistic shows 134217728.0000 which is higher than the critical region ±2.7764.
Another perfect correlation is found for a smartphone at 1.0000. The test of significance also rejects the null hypothesis where the test statistic 134217728.0000 exceeds the critical region ±2.7764.
Meanwhile, for a smart TV, the negative correlation is perfect at -1.0000, which means that whenever the education level increases, the observed count for smart TV ownership decreases. The correlation is significant here where the test statistic is -134217728.0000 which is less than the critical region ±2.7764. However, as this is one of the options where the respondent added to the survey, chances are other respondents weren’t aware of this feature when they filled in the questionnaire.
Lastly, the negative correlation is perfect at -1.0000 for Android TV Box. The correlation is also significant as the test statistic is 134217728.0000 and critical region ±2.7764. As the case of smart TV, the respondent might not be aware of the fact that they could add an option to their answer, hence the low count and hence the perfect correlation score.
The study with respect to whether a respondent used public Wi-Fi service provided by the government was also done. In this question, the respondent would answer either a yes, no or not sure/I don’t know.
The study of independence showed the prior experience with this government service is dependent on the education level of a respondent at test statistic 6.1483 which is higher than the critical value 5.9915.
| used_selangor_Wi-Fi | No | Yes | Not sure / I don’t know |
| education_level | |||
| Secondary school | 36 | 9 | 2 |
| Higher education | 33 | 25 | 3 |

The negative correlation is perfect at -1.0000 for cases where respondents had no experience using Wi-Fi services provided by the government. The negative correlation means the increase in education level decreases the count of responses answering No. The study of significance is recorded at -67108864.0000 which is lower than critical region ±12.7062.
For cases where the respondent used Wi-Fi services provided by the government, the correlation is perfect where the coefficient is 1.0000. Since the coefficient is positive, that means the increase in education level increases the count of responses answering no. The correlation is also significant where the test statistic is 67108864.0000, which is higher than the critical region ±12.7062.
Lastly, the correlation is also perfect at 1.0000 for cases where a respondent is unsure or does not know about the service. The correlation is significant where the test statistic is 67108864.0000 which is also higher than the critical region ±12.7062.
When we study age groups and the prior experience, we can also find these two variables are associated, the test statistic is 22.8679, which is greater than the critical value 18.3070.
| No | Yes | Not sure / I don’t know | |
| Age | |||
| (-0.001, 10.0] | 0 | 0 | 1 |
| (10.0, 20.0] | 2 | 3 | 0 |
| (20.0, 30.0] | 14 | 8 | 2 |
| (30.0, 40.0] | 34 | 17 | 2 |
| (40.0, 50.0] | 16 | 6 | 1 |
| (50.0, 60.0] | 4 | 0 | 0 |

The correlation is high at 0.6 for the case where respondents answered No, which means the increase of age yields higher count answering no. However, the correlation is not significant where the test statistic is 0.1167 and is within the critical region ±12.7062.
For the case where respondents answered yes, the correlation is very low at 0.1160. The correlation is however not significant as the test statistic is 0.1167 which is within the critical region of ±12.7062.
Lastly there is a negative correlation seen where the respondents answered unsure/I don’t know with the coefficient is -0.1195. This means fewer older respondents answering this option to the question. The correlation is also not significant as the test statistic is -0.1204 and critical region is ±12.7062.
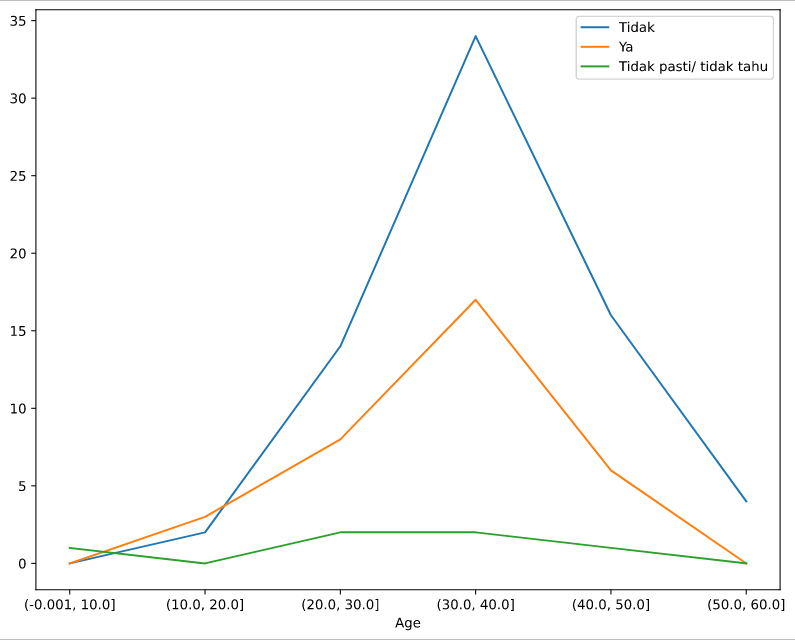
On the other hand, the question was also generalized to find if a respondent had prior experience in using a public Wi-Fi service. An association is found when the result is compared to the age groups of respondents where the test statistic is 31.1042 and critical value is 18.3070.
| No | Not sure / I don’t know | Yes | |
| Age | |||
| (-0.001, 10.0] | 0 | 1 | 0 |
| (10.0, 20.0] | 2 | 0 | 3 |
| (20.0, 30.0] | 12 | 0 | 12 |
| (30.0, 40.0] | 23 | 2 | 28 |
| (40.0, 50.0] | 14 | 1 | 8 |
| (50.0, 60.0] | 3 | 0 | 1 |
A high correlation is found at 0.6 where the respondents answered no, which means increase in age yields higher count for this answer. However, the correlation is not significant where the test statistic is 0.75 and critical region is ±12.7062.
The negative correlation is very low at -0.0308 for answer unsure / I don’t know. The negative correlation here indicates increase in age yields lower count for this answer. However, the correlation is not significant as the test statistic is -0.0308 which is within the critical region ±12.7062.
Meanwhile, the correlation is low at 0.2571 for yes as response to this question. The correlation is also not significant i.e. the test statistic is 0.2660 which falls within the critical region ±12.7062.
The ability to work from home is also another question included in this study. The test of independence rejects the null hypothesis when we compare age groups to the ability to work from home. The test statistic was calculated to be 22.4093 and the critical region is 18.3070.
| No | Yes | Not sure / I don’t know | |
| Age | |||
| (-0.001, 10.0] | 1 | 0 | 0 |
| (10.0, 20.0] | 0 | 2 | 3 |
| (20.0, 30.0] | 0 | 21 | 3 |
| (30.0, 40.0] | 11 | 34 | 8 |
| (40.0, 50.0] | 4 | 14 | 5 |
| (50.0, 60.0] | 2 | 2 | 0 |

There is some correlation at 0.5798 for the answer no, which means increase in age yields more count for this answer. However, the test of significance finds this correlation is not significant where test statistic is 0.7116 and critical region is ±12.7062.
A low correlation is found for the answer yes where the coefficient is 0.3769. The correlation, however is not significant as test statistic is 0.4068 and critical region is ±12.7062.
Lastly, the correlation is also low for the answer not sure / I don’t know at 0.2060. The correlation is also not significant, where the test statistic 0.2105 falls within the critical region ±12.7062.
Future enhancements
As most of the independence tests failed to reject the null hypothesis, it likely indicates
- There are not enough responses
- There is are flaws in the design of questionnaire, for example only 1 respond for the smart TV and android TV box ownership
If this study is to be repeated in the future, more encouragements to responses would need to be done. This should also help in correlation significant test when there are more responses.
Some respondents likely are unaware of the presence of “other…” option in the survey, or they did not think their answer is relevant. The question could be more descriptive so respondents would know what can be filled in.
Conclusion
Out of the 12 questions we analyzed with respect to the 5 classes of characteristics of respondents, the study found association to the following pairs of variables
- Household income vs monthly budget for Internet access service.
- Education level vs ownership and use of different types of Internet-enabled devices
- Education level vs prior experience with public Wi-Fi by state government
- Age vs prior experience with public Wi-Fi by the government
- Age vs prior experience with public Wi-Fi
- Age vs ability to work from home
Besides that the study also found correlation between the pair of variables in various degrees.
The Jupyter notebook of this analysis is published and can be found at <https://github.com/Jeffrey04/social-audit-2020/blob/master/report.ipynb>.