I came across a video on Youtube on Pi day. Coincidently it was about estimating the value of Pi produced by Matt Parker aka standupmaths. While I am not quite interested in knowing the best way to estimate Pi, I am quite interested in the algorithm he showed in the video however. Specifically, I am interested to find out how easy it is to implement in Python.
So the idea presented in the video is practically a series, where each term is shown as below:
Besides the alternating positive and negative sign, each term’s denominator is an odd number as well,
By summing up the series (it is a divergent series) up to n elements, and multiply it by 4, we should be able to estimate a value close to Pi. So in short, the value we are looking for is
Surprisingly, the above statement can be represented in a line of python code (assuming n = 100) without importing any package.
4 * sum((1 if k % 2 == 0 else -1) / ((2 * k) + 1) for k in range(100))
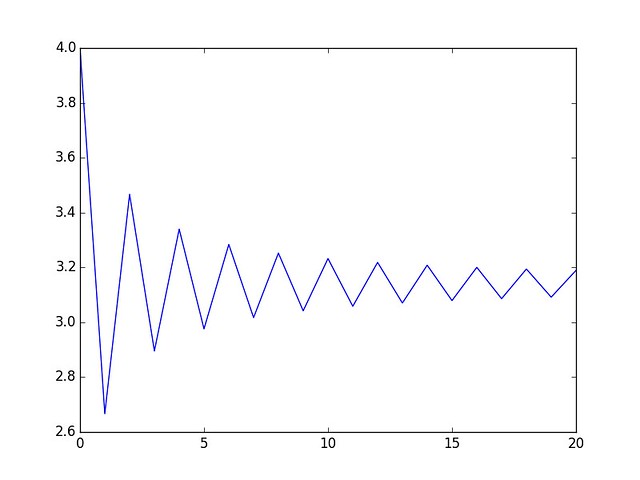
It is also noted in the video, where the estimated value of Pi is always alternating below and above the real value of Pi. In order to have an idea of how it looks in real life, I have expanded the code as follows:
import matplotlib.pyplot as plt
from itertools import count
from math import pi
import pandas
from sympy import *

def f(k):
    return Rational(1 if k % 2 == 0 else -1, (2 * k) + 1)

def item():
    for k in count():
        yield k, f(k)

total = 0
history = {'k': [], 'pi': []}

for k, item in item():
    total += item

    print('k = {}: {}'.format(k, (4 * total if k < 6 else 4 * total.evalf())))
    history['k'].append(k)
    history['pi'].append(float(4 * total.evalf()))

    if input('Continue? [Y|n]: ').strip().lower() == 'n':
        break

pandas.Series(history['pi'], index=history['k']).plot()

plt.show()
So running it (only tested with Python3, which is my default code target from now on) by allowing it to loop until k = 20 yields the result below:
The estimation does seem to be approaching the real value of Pi as n inceases. The reason I imported SymPy was to try seeing how the fraction grows, however it becomes increasingly difficult to make sense of after n > 5 hence I dropped the idea and show the result in decimal numbers instead.
So there it is, a quick and fun and short exercise in Python.

